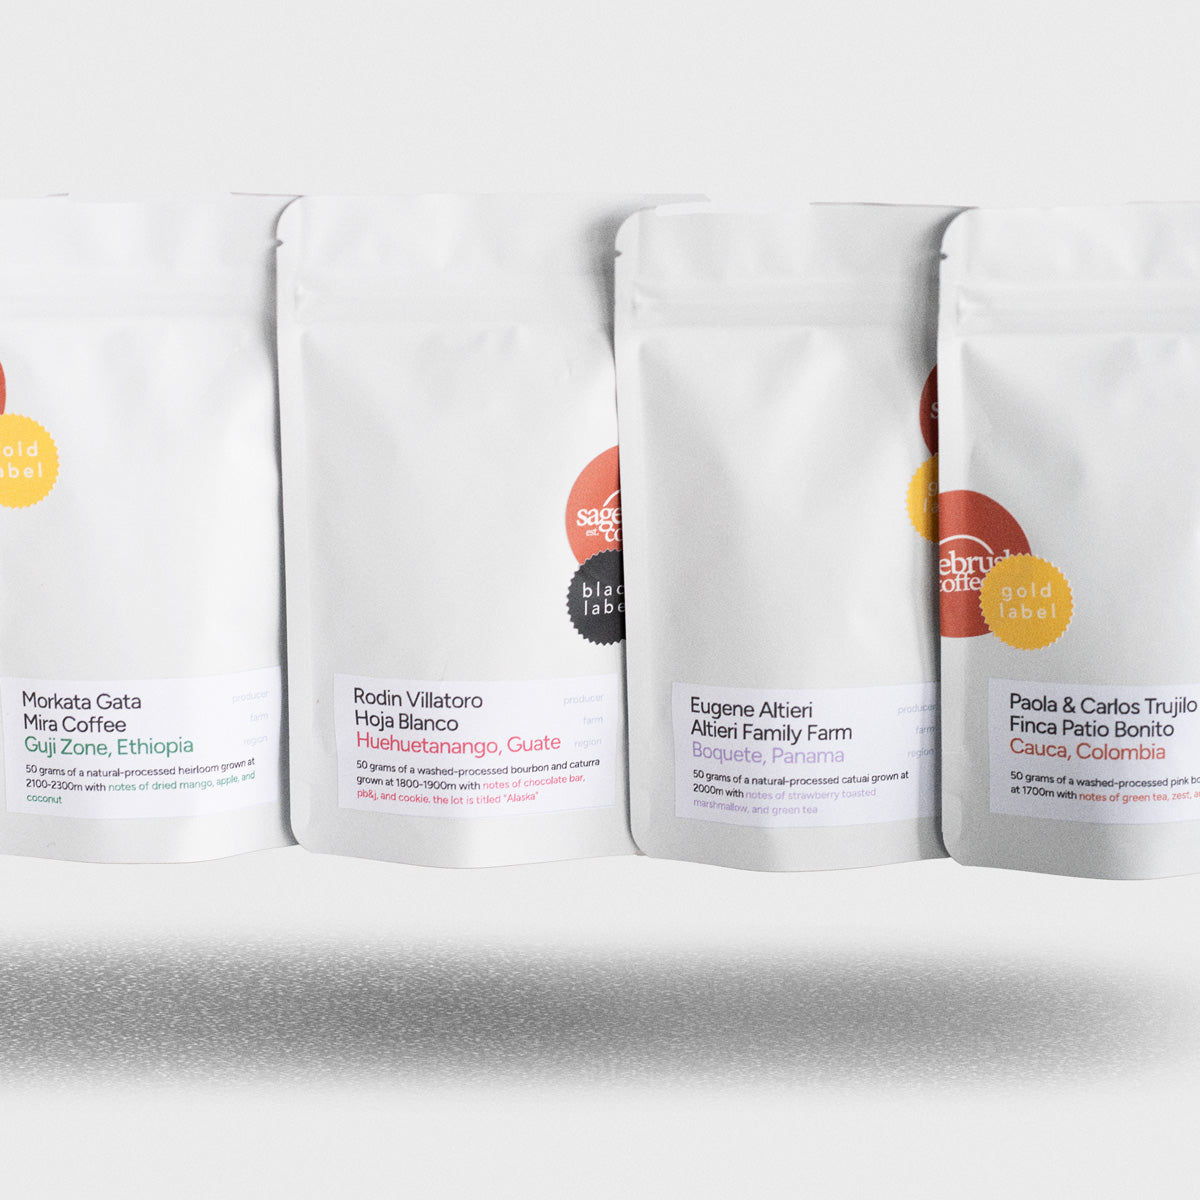
The specialty coffee industry is an ever-evolving world of creativity, new discovery, and status quo shifts; we here at Sagebrush are all for it. We are confidently in that 1% of supernerds that obsess over the tiny details. The focus of proper distribution to our brew, the micro adjustments to the grind-size, the research of processing on a beans flavor profile, the personal connection we garner with the producers from whom we source, every little thing you can think of about coffee is likely something we’ve spent hours reading up on, experimenting with, or simply enjoying. Although we are on the clock and at the end of the day need to turn a profit, a big portion of why we do what we do is because we love it. We love being a part of the specialty coffee industry and are dedicated to it. But none of this enjoyment, research, experimentation would be valuable at all if we kept it to ourselves. As partakers in this constantly developing scene, we are hugely focused on not only shifting our own personal thinking to that which is most beneficial to the industry but also educating and guiding our customers in that proper direction as well. This is why we are so excited about these new design elements we have added to our shopping experience. More focused farm details, photos of the beans to showcase the roast, breakdowns of the farming practices, and an entirely new naming system are all aspects of this redesign that we are eager to have rolled out with this reworking of the site. But, what we are most excited about is this new flavor profile chart.
The flavor profile chart is a graphic that is intended to visualize the flavor profile of any given coffee. The chart itself emulates the useful touch points of the new and improved 2023 SCA cupping score sheet. This chart represents the “descriptive” portion of a coffee’s characteristics. We aren’t evaluating quality with this chart by any means. There may be your own conceptions of which flavor notes you see as valuable, but keep in mind that stands as your own preference. Just because a painting has a lot of green paint in it doesn’t make it a better painting, BUT, if you don’t like the color green, then you will personally not prefer that painting. The same goes for coffee. One of our categories in the flavor profile chart is “vegetal.” For some, that may be a turn off, but personally, I am loving the uniquely green-like flavors we’re getting out of our new lot from La Cinta in Colombia. The chart is there as a tool to apply to your already-present preferences when it comes to coffee. To break it down, here are a couple key reasons why we’ve implemented this new system:
We want you to be informed.
As a consumer, you have a vested interest in being confident that you will like the product you are purchasing online. Without an opportunity for you to book a flight over to Chandler Arizona and purchase a pour over to taste the cup, you are left with a bag of assumptions about whether you will enjoy the bean on which you are spending $30+ dollars or not. This is the crux of why we have implemented this flavor profile system. We want you to have as clear of an idea of what you will taste when you brew at home.
And no, these charts are not some rudimentary guesstimation that we haphazardly plug into every bean without much intentionality. What we have actually done is formulate an internal cupping form that centers around this idea of presenting to you a clean, clear representation of what we are picking up in the coffee’s cupping profile. Throughout our time at Sagebrush, we’ve used simple sheets of paper (or our phones) to take general notes of coffee we are cupping at the time. Now, we use these tasting sheets as we cup every new coffee that comes into the shop. Each category on this flavor profile chart is its own 1 to 10 evaluative score. We cup multiple coffees together as a team with concise discussion of every single category for every coffee on the table. It’s an intensive process, but in the long run will give us an incredible archive and running system that accumulates hundreds of relative comparisons between many many coffees. For most of these categories in this profile chart, we typically have a certain coffee in mind as our “10/10” rating (ex. “is this as fruity as our 2022 Ethiopia Guji Natural coffee?”), which allows us to anchor a stream of consistency within each of these descriptor categories. Accuracy, descriptiveness, readability, and ultimately, clear information. That is what we want you to take away from these charts.
We want to whittle down misconceptions about a coffee’s flavor.
Flavor notes have taken the specialty coffee industry by absolute storm over the past couple decades. It is almost a non-negotiable to put specific notes on your bag of beans. It’s not uncommon to take a look at a coffee bag and read off written notes of chamomile, slightly toasted wafer, overripe fuji apples with a dash of cinnamon, twice baked 78% dark chocolate chunk cookies with 3 grams of salt, turbinado sugar harvested in July on a slightly overcast day in 88-degree weather, and so on. In all seriousness, this trend of flavor notes has become a slight problem. People like to say (or hear themselves say, rather) that there is indeed objectivity to what they are tasting in a cup of coffee. But the fact of the matter is ten times out of ten, the notes attributed to a coffee aren’t scientifically there. It’s true that a primarily acidic flavor profile might bring out notes of raspberry, since raspberry is an acidic fruit, but does that discredit any idea that it may taste like blackberry? Or kiwi? Or pineapple? Or tart apple? Or sour candy? Or cranberry? Or lemon? Or tart cherry? Absolutely not! Believe it or not (and this is coming from someone who’s paid to have a developed palate that can easily distinguish profiles and notes) taste is…. subjective!! There are no objective raspberry molecules in your cup of coffee, there are no measurable cocoa particles in your bean, and as crazy as it may sound, there are no blueberry particles in your natural Ethiopian coffee. What we are describing is our perception of coffee particles on our tongue, what it reminds us of, and attributed notes to that cup that may be familiar to the average joe. There is no objectivity to a flavor note. Don’t misunderstand, notes are indeed helpful. If I like fruitier coffees then I will be looking for those notes on a bag, but that ought not to establish that I will taste a raspberry in my coffee when brewed.
So, what exactly does this have to do with our flavor profile charts? What we are hoping to do with these charts is be among the many seeking to correct this industry-wide pretentiousness and provide consumers with a more generalized understanding of the overall profile of a coffee. Even in our three notes that we provide in our products we have explanations of each of the notes. In those explanations, there is a more big-picture explanation of what we were perceiving in the cup rather than a prooftext for why lemon particles are in this coffee. Our profile charts are designed to give you a brief overview of the profile’s characteristics. This will also help give relative comparisons to other coffees we offer that you may have already tried. If you like the chocolatey nature of a washed Guatemalan coffee that you regularly get, then referencing the flavor profile chart of other coffees and finding beans that have a similar chart will be your best bet of a similar cup. The opposite is true as well; this chart can act as a way for you to breach your comfort zone as well. The applications are numerous for this new system, and our hope is that once our customers acquaint themselves to it, that it will become hard for them to live without it.
This update to our overall look and feel not only brings a fresher look and feel, but a new approach to evaluating and comparing coffees for our shopping experience across the board, and we hope this was a helpful crash course for you to step into this new system with us!
